Ask how many students finish the average online course and the honest answer is: most never do. Free self-paced courses complete in the single digits to low teens; even good paid courses lose a third or more of their students. But averaged numbers hide the real story — completion varies by nearly 10x depending on how a course is priced, structured, and delivered, which means completion is not a fact of nature. It is a design decision.
This post collects the credible numbers in one place, explains where students actually drop off, and ranks the fixes by how much they move the rate — because for a course business, completion is not a vanity metric. Students who finish leave testimonials, refer friends, skip refunds, and buy the next thing. As our guide to selling online courses puts it: a finished student is the cheapest marketing you will ever run.
The headline numbers
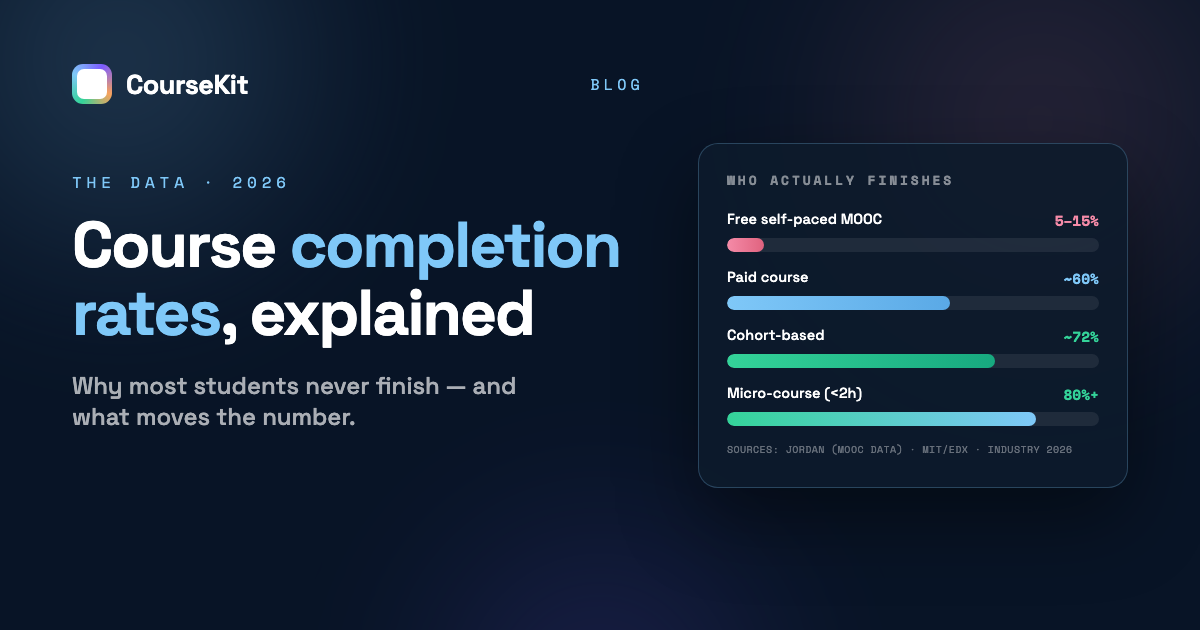
| Format | Typical completion | Why |
|---|---|---|
| Free self-paced MOOC | 5–15% | No money committed, no schedule, no one watching |
| Paid self-paced course | ~60% | Financial commitment — roughly 8x the free rate |
| Project-based course | ~65% | Tangible output after each module |
| Cohort-based course | ~72% | Deadlines, peers, live sessions |
| Employer-sponsored program | ~72% | Career stakes plus dedicated time |
| Micro-course (under 2 hours) | 80%+ | Small enough to finish before life intervenes |
On provenance: the academic baseline comes from Katy Jordan’s well-known analysis of MOOC data, which found completion ranging from under 1% to 52% with a median around 12.6%, and later multi-platform studies averaging roughly 15%. The format comparisons above aggregate 2024–2026 industry reporting; treat them as directional benchmarks rather than laboratory constants — platforms measure “completion” differently, and paid-course figures in particular vary with price and audience.
Zoom into individual platforms and the same pattern repeats. Reported figures put Coursera’s paid certificate programs around 55% and edX verified tracks around 48% — both an order of magnitude above their free audit tracks. Google’s project-heavy Career Certificates report about 58%. FreeCodeCamp, free but entirely project-based, sees roughly 22% for full certifications yet ~45% for individual sections — shorter goals, higher completion. And LinkedIn Learning’s enterprise completion (~42%) runs well ahead of its individual subscriptions (~25%): same courses, different accountability. Every gap in that list is one of the levers below doing its work.
Two things stand out. First, the gap between the worst format (free, long, self-paced) and the best (short, paid, structured) is enormous — roughly 10x. Second, every high-completion format shares the same ingredients: commitment, structure, and accountability. Those are exactly the levers you control.
Where students actually drop off
Dropout is not evenly spread. Enrollment analyses consistently find that about half of all dropouts happen in the first two weeks — roughly 30% after week one and another 20% after week two, with the curve flattening from week four. The mirror image is more useful: students who get through the first third of a course have been observed to finish about three-quarters of the time.
Why do they quit? Survey data on non-completers points at lack of time (~38%) far ahead of lost motivation (~25%), difficulty (~14%), and irrelevance (~10%). Note what that means: most dropouts did not dislike your course — life simply outcompeted it. The average learner plans an hour a day and actually finds twenty minutes. Courses designed for twenty-minute sessions survive contact with reality; courses designed for weekend marathons do not.
One more finding worth internalizing, from MIT/edX video research: median engagement with a lecture video is about 4.5 minutes regardless of the video’s length, and videos beyond six minutes lose roughly half their viewers. The six-minute lesson is not a style preference — it is where attention actually runs out.
Seven levers that move completion, ranked
1. Charge for it
Payment is the single strongest completion predictor in the data — paid learners complete at several times the free rate, and even a small payment multiplies follow-through. If your course is free as a lead magnet, that is a marketing choice with a known completion cost; for anything whose outcomes matter, price it. (Our pricing guide covers what to charge.)
2. Shorten the path to done
Length is the second-strongest predictor: under two hours completes at 80%+, while 20+ hour epics fall below 20%. You do not have to teach less — restructure. Ship the core transformation as a tight flagship and move the encyclopedic depth into bonus modules, a resource library, or a second course. “Done” must feel reachable from day one.
3. Win the first two weeks
Since half of all dropouts happen there, front-load the experience: a first small win inside lesson one (not the tour of what is coming), an immediate hands-on task, and a personal note from you in the first 48 hours. The launch playbook’s week-after checklist exists precisely because onboarding is completion work — and the onboarding email sequence is its engine.
4. Make them build something
Project-based courses complete at roughly double the lecture-only rate, and a student who just built something is far more likely to start the next module than one who just watched something. Every module should end with an artifact — a worksheet completed, a page shipped, a track exported.
5. Add people
Cohorts hit ~72% because peers and deadlines create the accountability self-paced courses lack. You do not need a full cohort model to borrow the effect: a community space beside the course, a visible study group, or even a shared start date for each intake recovers much of it.
6. Keep lessons at six minutes
Cut to the attention data: 5–12 minute lessons, one idea each, with something to do every few minutes. Interactive checks every 3–5 minutes measurably lift retention. A 60-minute recording is not one lesson — it is ten unedited ones.
7. Nudge on progress, not on absence
Drip content so day one is not a wall of forty videos; send progress notes (“you're 60% there”) rather than guilt (“we miss you”); add streaks or badges if they fit your brand — gamification lifts completion meaningfully, with progress visualization the most reliable element. All of this is infrastructure: drip, progress emails, certificates, and community are exactly the features to check for when choosing a platform. (They ship on every CourseKit plan, including Free — completion tooling should never be an upsell.)
Instrument your own funnel: five checkpoints
You cannot improve a number you are not measuring, and “completion rate” alone is too blunt to diagnose anything. Track five checkpoints per intake instead:
| Checkpoint | What it tells you | Healthy sign |
|---|---|---|
| Started lesson 1 within 48h of buying | Onboarding strength | 80%+ |
| Finished module 1 | Whether the first win lands early enough | 70%+ |
| Reached the one-third mark | Your best predictor of eventual completion | 55%+ |
| Completed within 90 days | The headline rate, consistently defined | 50–65% (paid) |
| Left a testimonial or referral after finishing | Whether completion converts to growth | 25%+ of finishers |
The diagnostic logic runs top-down: a weak 48-hour number is an onboarding problem, a strong start with a weak one-third number is a length or difficulty problem, and strong completion with no testimonials is an ask-timing problem. Fix the highest checkpoint that is failing first — everything below it usually improves for free.
What a realistic target looks like
Do not benchmark yourself against the 5–15% MOOC headline — those are free courses at massive scale. For an independent paid course with a warm audience, 50–65% completion is a realistic, achievable target; add cohort mechanics or projects and 70%+ is in reach. Below 40% on a paid course, the data says to look first at length, then at the first two weeks, in that order.
And measure the number that matters for the business: completion-to-testimonial. If finishers are not turning into reviews, referrals, and repeat buyers, completion is leaking value at the last step — ask at the moment of the final lesson, not months later.
Online course completion rates: FAQ
What is the average completion rate for an online course?
For free self-paced courses, 5–15%, with academic studies finding a median around 12–13%. Paid courses average around 60%, cohort-based and employer-sponsored programs around 72%, and very short courses exceed 80%. There is no single “average” — format dominates the outcome.
Why are MOOC completion rates so low?
Three compounding reasons: nothing was paid, so nothing is lost by quitting; the courses are long and self-paced, so there is no deadline pressure; and enrollment is free, so many “students” were only ever browsing. Low MOOC completion says more about free, unstructured formats than about online learning itself.
What is a good completion rate for a paid online course?
50–65% is solid for a self-paced paid course; 70%+ is excellent and usually means cohort mechanics, projects, or a tightly-scoped curriculum. If you are under 40%, the highest-leverage fixes are shortening the path to done and rebuilding the first two weeks.
Does course completion actually matter for revenue?
Directly. Finishers leave testimonials, refer students, request refunds less, and buy follow-on products — non-finishers quietly do the opposite. Completion is a growth metric wearing a support metric’s clothes, which is why the levers above are business investments rather than pedagogy niceties.
How do I measure completion rate properly?
Pick a consistent definition — percentage of paying students who reach the final lesson within 90 days is a good one — and track it per cohort or intake, not as an all-time blend. Watch two supporting numbers: percentage reaching the one-third mark (your early-warning signal) and median days to finish. Improving the first-third number almost always improves the rest.
Written by Dr. Hesham Mashhour, author of Start Your Online Course Business Today and founder of CourseKit — the course platform that runs inside your own Webflow site, with drip, certificates, community, and progress tracking on every plan and a transaction fee that falls to 0%. See what is included →